A salary on a spreadsheet doesn't tell you much by itself. It gives you a dollar amount without telling you whether the employee is new to the role, nearing the top of the band, or sitting in a range that has drifted behind the market. You need the range around it, then two calculations: compa-ratio and range penetration.
Compa-ratio compares salary with the range midpoint. Range penetration measures how far the salary has moved from the bottom of the range to the top. Together, they help you see whether an employee is still moving toward the market target, running out of room in the band, or sitting in a range that needs attention. They turn a row in a grid into a useful first read on a pay decision.
Start with the range.
The range sets the frame
A salary range has three anchors: a minimum, a midpoint, and a maximum. The midpoint is the market target for someone who is fully proficient in the role, fully ramped, and performing to expectations.
Companies typically set the minimum some percentage below midpoint and the maximum some percentage above it. A common structure for individual-contributor roles sets the minimum at 80% of midpoint and the maximum at 120%. That produces a 50% range spread. Put another way, the maximum is 1.5 times the minimum.
If the midpoint for a Senior Analyst is $100,000, an 80/120 range might run from $80,000 to $120,000. Compa-ratio and range penetration describe the employee's salary inside that range, from two different angles.
Compa-ratio: distance from the midpoint
Compa-ratio is short for "comparative ratio." It answers a direct question: how does this employee's pay compare with the midpoint of the range?
The formula is:
Compa-ratio = salary / midpoint
Use the Senior Analyst range with its $100,000 midpoint. An employee paid $92,000 has a compa-ratio of $92,000 / $100,000 = 0.92, or 92%. Another employee paid $108,000 has a compa-ratio of 1.08, or 108%.
A compa-ratio around 1.0 puts the employee at the market target for a fully proficient performer. Below 1.0, the employee sits below that target. They may be newer to the role, still developing, or short of full proficiency. For someone with a year or two in the seat, that can be normal and expected.
Above 1.0, the employee sits above midpoint. You may be looking at a seasoned employee, a top performer, or someone whose pay has climbed through years of increases without being checked against a new range.
I get nervous when compa-ratios sit well above 1.0 without a performance story to support them. The range may be stale and behind the market. The company may also have awarded increases without checking whether the employee had grown into the higher pay. High compa-ratios can create a less obvious flight risk, too. Employees near the top of a range are sometimes the first to leave when their current band gives them nowhere else to go.
Range penetration: progress through the band
Range penetration measures the employee's position from the minimum to the maximum.
The formula is:
Range penetration = (salary - minimum) / (maximum - minimum)
Multiply the result by 100 to express it as a percentage.
Return to the same range: $80,000 minimum, $100,000 midpoint, and $120,000 maximum. For an employee paid $92,000, the calculation is ($92,000 - $80,000) / ($120,000 - $80,000) = $12,000 / $40,000 = 0.30, or 30%. The employee has moved 30% of the way through the range.
The two calculations answer different questions about the same salary. At 92% compa-ratio, the employee is 8% below midpoint. At 30% range penetration, the employee still has plenty of room before reaching the maximum. Compa-ratio measures distance from the market target. Penetration measures how far the salary has moved through the band.
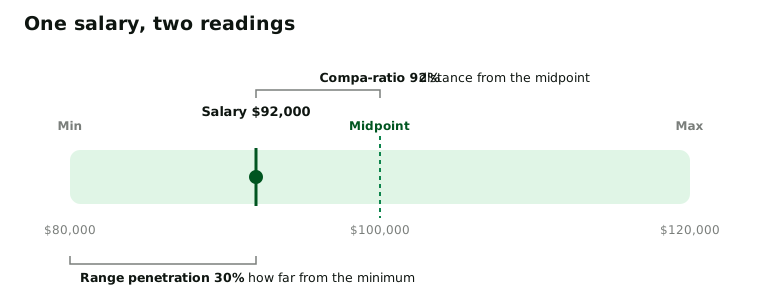
I reach for penetration most often when I consider increases, because the remaining runway affects the next pay decision. An employee at 95% penetration will move into the red zone near the maximum after a large merit increase, then stall out fast. An employee at 20% penetration has room for a reward without creating that problem.
Read the team, too
One employee's compa-ratio gives you a snapshot. The average compa-ratio across a team gives you a signal about the group.
Suppose a department's average compa-ratio is 0.92. On balance, the team is paid below midpoint. The team may skew junior, with many employees still developing into their roles. That is fine. Pay may also have fallen behind the market, which means the range midpoints need a refresh. Tenure and performance will tell you which explanation fits.
At an average of 1.06, the team is running hot. You may have seasoned employees clustered near the top of the range. Your ranges may also trail the market, while employees have crept above midpoint to keep their pay competitive.
Either explanation points to budget pressure. Standard merit increases will begin pushing employees against the maximum, and an across-the-board increase will cost more than it first appears.
I watch team compa-ratios the way a CFO watches gross margin. They drift, and that drift tells you something before the full story appears anywhere else. The average gives you a reason to open the data and find out what changed.
Add context before you judge
Comp professionals make this mistake even after a few years in the job: they see a compa-ratio of 0.85 and call the employee underpaid. The number means the employee earns 15% below midpoint. The ratio alone can't support that conclusion.
Remember what midpoint represents: the target for a fully proficient performer. An employee who joined six months ago and is still ramping may belong at 0.85. You would expect that employee to move toward 1.0 over the next couple of years. Calling the employee underpaid would confuse a normal career stage with a pay problem.
Apply the same care above midpoint. A compa-ratio of 1.15 can make sense for a strong performer with a decade in the seat. A 1.15 compa-ratio for someone in year two who is meeting expectations raises a flag. The range may sit too low for the market, or the pay decision may need another look.
Tenure, performance, time in role, and the date of the last range refresh turn the ratio into a sound judgment. The ratio gets you to the question faster.
Build the habit
Whenever you review a salary, run both calculations. Ask where the employee sits relative to midpoint, then ask where the employee sits in the full band. You won't always have a calculator, and you won't always need one. Rough mental math is usually enough to tell you whether the result looks normal or needs review.
Compa-ratio tells you how pay compares with the market target. Range penetration tells you how far the salary has moved through the band. Learn to read both, and they become the first place you look for the questions behind the salary.